
Current events make the need for open education greater than ever, but there are fewer resources available to support this work. This series of posts considers three ways to change the frame on how advocates make the case for OER.
OER program models: Causal loop diagrams
This post considers how open education programs at the institutional and state levels are affected by the overall higher education environment. A causal loop diagram is good for looking at a few elements in a system to examine relationships.
Last summer I explored scenarios showing what this academic year might bring for Oregon’s public higher education, and how the statewide OER program might respond. These are the scenarios I envisioned:
- Lemons: Mid-biennium budget shortfalls due to recission (state government clawing back funding from institutions) and enrollment drops are followed by further cuts in 21-23.
- Lemonade: Things aren’t “back to normal” (eg majority of classes remain online/remote) but after belt-tightening, higher ed budgets have stabilized (at lower levels) for the 21-23 biennium and may see increases for 23-25; vaccine enables campuses to reopen during 21-23.
- Moldy old blob in the back of the fridge: Massive shortfalls, steep enrollment drops, state funding drops to $0, no federal support, ongoing uncertainty about virus outbreaks make in-person instruction impossible through 2023.
You can see some of the guesses I made about different aspects of the situation that affect Open Oregon Educational Resources in the spreadsheet Pandemic Scenario Planning. Six months later, Oregon is relatively lucky to be in a “lemonade” scenario in terms of projected state funding for higher education in the next biennium. One question that I was wondering about while doing this scenario planning exercise was what individuals, programs, and institutions could potentially do to avoid or mitigate the worst impacts of “lemons” and “moldy blob” scenarios. This is where causal loop diagrams come in.
Causal loop diagrams use the words “positive” and “negative” to describe correlations (not values, which is a bit counterintuitive). A correlation is positive if two elements track together, whether they’re both increasing or both decreasing. A correlation is negative when two elements track in opposite directions – when one increases, the other decreases, and vice versa. An entire loop is called balancing if there are an odd number of negative feedback relationships, and the loop is called reinforcing if there are an even number of negative feedback relationships (including zero).
For example, if you leave the bathtub tap running with the drain open, that’s a balancing feedback loop that will reach equilibrium. The fact that my living room chairs are in terrible shape is an example of a reinforcing loop: my cat loves to be chased, so the more I chase him away from the chairs, the more he wants to scratch them in order to be chased.
In the causal loop diagram below, state revenue has a negative correlation with tuition: when revenue decreases (as it is currently doing), institutions raise tuition in order to make up the difference in their budgets. Tuition and enrollment also have a negative correlation: tuition hikes lead to enrollment declines because fewer students can afford to attend college. Enrollment and retraining have a positive correlation: when enrollment decreases, that means that fewer people are able to retrain in order to seek new employment. Closing the loop, the final relationship is the positive correlation between retraining and state revenue: with fewer people retraining, state revenue will decrease because the tax base will be smaller and more people will be drawing on public support services.
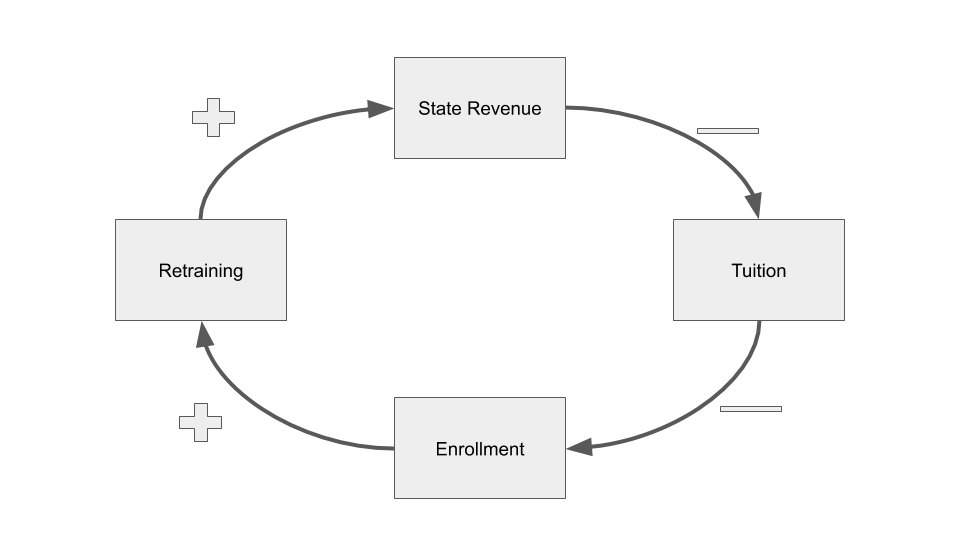
These elements are in a reinforcing loop, which means that unless you change something about the model, if state revenue continues to decrease and tuition continues to increase, Oregon’s economy will be in worse and worse shape as students are priced out of higher education. For example, if the federal government offers support to states to enable increased funding for higher education, institutions may be able to decrease tuition. That would enable more Oregonians to enroll and retrain in order to get new jobs, which in turn boosts state revenues.
Coming back to the scenarios in the spreadsheet, causal loop diagrams can suggest ways to make lemonade. For example, one internal textbook affordability impact that I categorized under “lemons” is: “Recognition that this is important to students but low institutional bandwidth to address the problem. Possibility that individual champions continue to make progress in pockets; or possibility of top-down initiatives where admin mandates use of OER.”
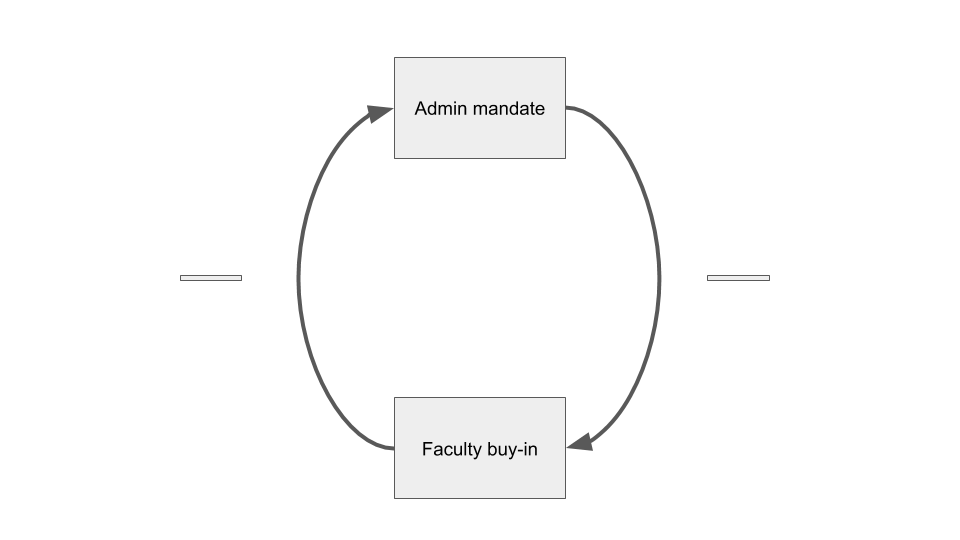
To be honest, it hadn’t occurred to me that administrators would mandate OER, since a more common narrative is the struggle to gain admin’s buy-in, support, and recognition. This outcome was suggested by my supervisor, and she was right to suggest it: as early as spring term, one of Oregon’s colleges was exploring this option. This could lead to a problematic reinforcing feedback loop, as shown in the diagram below. The more that admin insists that faculty adopt OER, the less buy-in they’ll have from faculty; and less faculty buy-in there is, the more the OER program will have to make progress through mandates rather than authentic faculty motivation.
To my knowledge, an OER mandate hasn’t been implemented in Oregon. But if it were, how could Open Oregon Educational Resources respond in order to interrupt this reinforcing feedback loop, while still encouraging increased OER use, and assuming good intentions by all stakeholders? The model suggests that the less OER is seen as a mandate, the more faculty will buy in, and the less the program will have to rely on top-down tactics to make progress. So, a few ideas:
- Work with the institution’s OER point person to soften the language in the mandate to be more sensitive to academic freedom and faculty choice;
- Schedule meetings with administrators to brainstorm some “carrots” or other approaches to encourage faculty buy-in
- Provide state-level professional development opportunities that help bring faculty motivation in line with the institution’s goals.
Another approach, of course, would be to try to change one of the elements in the model. If the institution were willing to swap “admin mandate” for “admin support,” the situation would change, though not immediately – first, admin would need to regain the trust that it lost by implementing a mandate in the first place.
A relationship that I’ve been talking about in budget discussions in order to advocate for statewide OER funding is also helpful to see as a diagram: as institutional budgets are cut, there are fewer internal resources available for professional development. If we can meet that need by allocating funding at the state level, faculty will still be able to help students by implementing OER in their courses, but the pressure on scarce institutional resources will decrease. The diagram below shows this with a positive correlation between the pressure on institutional resources and the allocation of funds for statewide professional development, since I’m arguing that they should increase together; a negative correlation closes the loop as statewide funding makes up for cuts at the institutional level and reduces pressure on institutional resources.
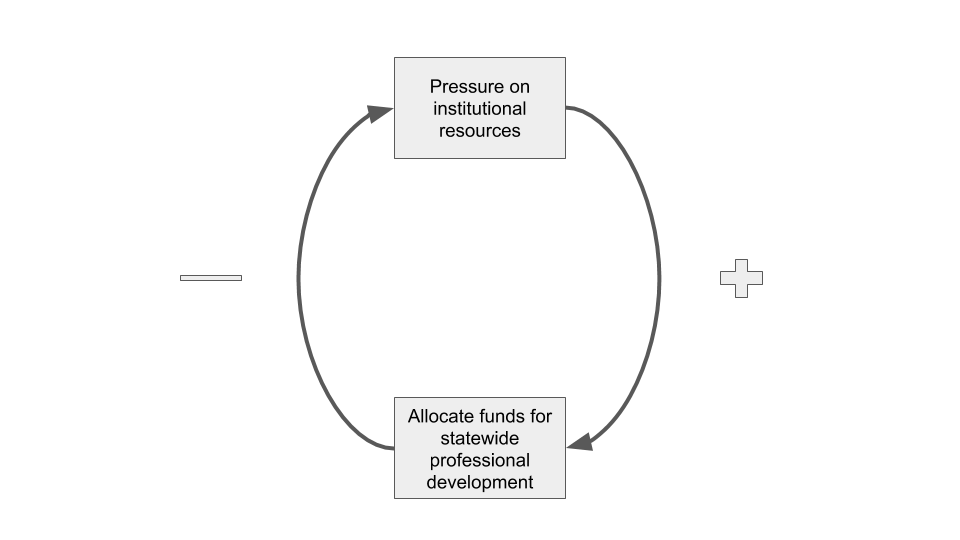
Note that this is a balancing loop, which implies that the two elements will eventually reach an equilibrium. Coming back to the point about models in general, though: “All models are wrong, but some are useful” (attributed to George Box). This model is a simplification that enables me to focus on a relationship between just two elements in the overall system of statewide open education – institutional resources and state-level program funding – in order to illustrate why, right now, Open Oregon Educational Resources should continue to be funded at least at its current level in order to fill gaps left by budget cuts at the individual institutions. However, thinking beyond the immediate budget cycle, we would need to include the morale of point people and faculty at under-resourced institutions over time. We would also need to think about how far the statewide program capacity can stretch before the quality of the offerings suffers.
Are there other examples of balancing or reinforcing feedback loops that enable us to shift the conversation about open education? Please leave a comment!

Exceptional analysis, with, of course, some personal caveats. Done well (and I know of a place where it is being done well) a mandate can work with the right supporting structure. Think of it this way. Most faculty are OER curious (Bay State surveys). They are like kids at a swimming pool, sometimes they just need a hug and a shove into the water.