
Spring is here – does that make anyone else think about collecting data? The archived webinar on estimating student savings from no-cost/low-cost course materials will be available soon, but in the meantime the presentation slides are available: https://tinyurl.com/savingsestimates. This blog post summarizes the main points of the presentation.
Practices vs Best Practices
There are a variety of savings data collection methods in use in Oregon at the moment. There isn’t a particular method that can be considered “best practice,” because there are so many local considerations that go into determining how to track data.
That said, there are some best practices when it comes to handling student savings data, regardless of method:
- Be transparent and consistent when reporting savings.
- Build relationships with the people that manage existing data sources.
- Stay focused on the big picture: saving money has a big impact on students, regardless of the method used to calculate the amount.
The primary message is that saving money on course materials matters to students – don’t let your data collection method or presentation style distract your audience from this core issue.
Tracking decisions
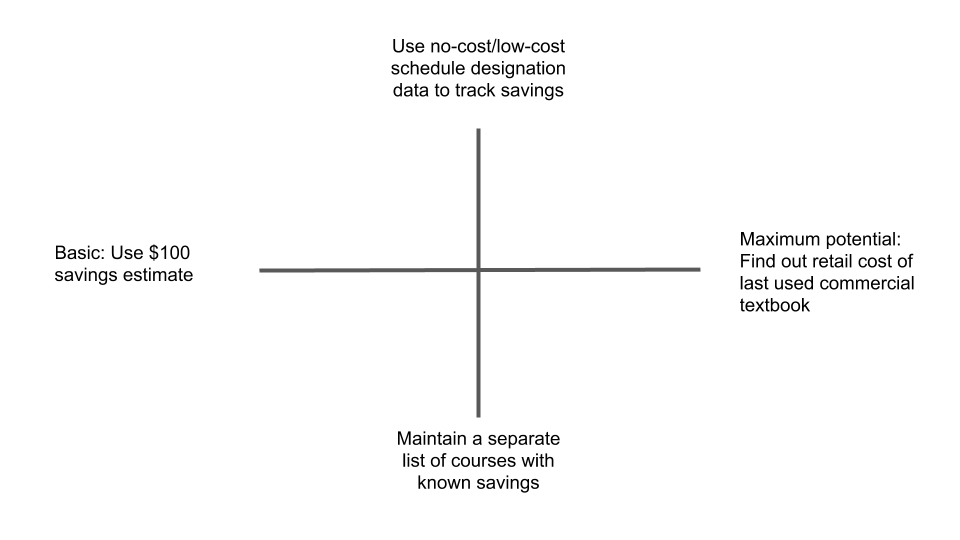
The graphic below shows how a data collection method might fall into one of four quadrants based on two basic decisions, extrapolated from practices used by OER coordinators at Oregon community colleges.
- Use the basic $100 per student per course savings estimate, or find out the retail cost of the last used commercial textbook;
- Use no-cost/low cost schedule designation data to track savings, or use a variety of data sources to maintain a separate list of courses with known savings.
 x axis
Using the basic savings estimate emphasizes that your savings numbers are just that – an estimate, not exact figures. This approach accounts for affordability efforts at bookstores (used, rentals, etc), as well as student behavior (sharing, selling back, etc). It is a little bit less work to implement because you don’t need to gather data on past textbook prices.
On the other hand, some schools prefer to report on the maximum potential savings as a result of no-cost/low-cost materials. This approach emphasizes the high textbook prices that result from what the Student PIRGS calls a broken market. It highlights the face value of what the syllabus asks of students. It does take extra effort to collect this data, which may make this approach more difficult to scale at a large institution.
y axis
In 2015, Oregon passed HB 2871, which mandates that every public college and university prominently designate no-cost and low-cost courses in the schedule. There are logistical hurdles to collecting and displaying this information, as we covered in a recent webinar, but once you have a course list it might make sense to use that list to track student savings. This way you can maintain one list of no-cost/low-cost courses and use that list for multiple purposes. If this is your approach, outreach to faculty on how and when to report adoptions becomes even more important since you will have multiple processes depending on accurate and on-time reporting (and we know from bookstore managers’ frustration with HEOA reporting that this is no small feat).
On the other hand, some institutions will maintain a separate list of courses where there are known materials savings. In some cases this information is used to track all student savings, even where costs don’t meet no-cost/low-cost criteria – for example, if replacing one required textbook with a library ebook makes required materials costs drop from $130 to $110, you can track that $20 savings even if the materials cost is still above the low-cost threshold at your college. In other cases, maintaining a separate list enables schools to track based on more restrictive criteria – for example, tracking only savings resulting from use of openly licensed materials. As opposed to the single data source method described above, this approach draws from multiple data sources, including bookstore data, OER grant program data, and so on.
The x and y axes in the chart above both represent a spectrum rather than a binary. On the x axis, for example, a college might decide to use the maximum potential savings number, but use the $100 estimate for brand-new courses that don’t lend themselves to collecting historic price data at the bookstore. Likewise, on the y axis, colleges that track no-cost and low-cost courses in order to implement the schedule designation might double check faculty reporting against a bookstore data dump to find additional courses that don’t require any purchase.
Data needed
The formula for calculating materials cost savings looks like this:
[# of students] x [$ saved] = [savings estimate]
On the back end, it can be very complex to find the numbers to plug into this seemingly simple formula.
# of students
There are two steps to count the number of students impacted by no-cost/low-cost course materials.
First, which sections are being counted? As described in the previous section, you might use your schedule designation list as a data source, or you might use a variety of sources to generate a standalone list of course sections that meet your criteria (any savings, OER only, etc).
Second, what is the enrollment in those sections after last withdraw/drop date? The most reliable way to get this data is through the student information system (SIS). If the person coordinating the OER program on campus doesn’t have access to SIS data, then collaborating with institutional researchers or others who do have access will be necessary.
If it’s really impossible to access SIS data, then a workaround is to ask faculty in the identified sections to self-report their enrollment numbers. This option has significant drawbacks: you risk an incomplete response rate, inaccurate reporting, and over-burdening the people who are already very busy redesigning their courses to use lower-cost materials.
$ saved
There are one or two steps to estimate savings, depending on whether you are considering no-cost or low-cost courses.
In the case of no-cost courses, your basic or maximum potential savings estimate will be the multiplier for the section enrollment number found in the previous section.
In the case of low-cost courses, you need to take the additional step of finding out what the new materials cost is. The savings estimate is the basic or maximum potential savings number minus the new cost.
There are three potential data sources for the cost of course materials (old and new). First, you may be able to use the bookstore’s public-facing website to look up price information for current and past terms. Second, the bookstore manager may be able to provide the information needed, especially if you need to look up older price data. Third, faculty are another source of data, but with the same drawbacks as discussed above.
Templates
The templates below are openly licensed. Feel free to make a copy and modify to suit your needs. If you make major modifications or use a significantly different tracking method, please use the comments below to contribute your thoughts.
- Basic savings estimate for $0 courses: https://tinyurl.com/basic-0
- Maximum potential savings estimate for $0 courses: https://tinyurl.com/max-potential-0
- Basic savings estimate for $0 and low-cost courses: https://tinyurl.com/basic-no-low
- Maximum potential savings estimate for $0 and low-cost courses: https://tinyurl.com/max-potential-no-low
- Basic savings estimate, separate from schedule designation: https://tinyurl.com/basic-savings-all
- Maximum savings estimate, separate from schedule designation: https://tinyurl.com/max-savings-all
Why track savings data?
Student savings data provides a powerful argument when you are advocating for funding or support for textbook affordability at any level – in your department, institutionally, systemwide, or statewide.
In Oregon, the student savings that is not associated with program spending is like the dark matter that makes up most of the universe – we have a high level of faculty awareness and many instructors choose to use no-cost or low-cost course materials on their own, without receiving a grant or stipend. It’s important to report on the result of these efforts in order to show the impact of faculty choices.
For student savings that is associated with program spending, it’s essential to be able to show the impact of that funding. Student savings can be expressed as a total number as a result of a particular program over time, or as savings per $1 in program money spent over time.
Savings data may lead to other reportable findings, such as an analysis of which disciplines are seeing success in reducing materials costs, or tracking which OER are being adopted. However, unless you have a plan in mind for a specific type of data, it’s usually better not to make extra asks. The Open Oregon Resources page is an example of a very narrowly defined data set – the sole purpose of the page is to list known adoptions in Oregon, so we don’t also ask for savings data there.
Finally, a reason to track savings data is to encourage collaboration. Stated alternatively, fostering competition is definitely not a good reason to track data. As the saying goes, “comparisons are odious.” We’re all working together to promote student success, so sharing student savings data is an avenue to showcase what’s working well and what might be applicable at another institution.

Thanks for sharing this well thought out discussion on tracking adoptions/saving. Very useful information.
Pingback: Estimated 2017-18 Student Savings in No-Cost/Low-Cost Courses – openoregon.org
Pingback: Starting From Scratch: OER at a Small Liberal Arts College