
This post reports on the statewide estimated student savings represented by Oregon’s no-cost/low-cost course designation for the 2021-23 biennium, mandated by Oregon’s HB 2871 (2015).
Each community college and university reports savings data using the method that works best for their own local campus environment. This means that the people who created the data make the case for how they use it. Each institution shows their work by sharing their method so that the aggregated estimate can be understood as a sum of differentiated components.
It is important to collect and share this data because it communicates the effectiveness of the no-cost/low-cost schedule designation and also shows the impact that faculty choices have on students. However, savings estimates will always be just that – an estimate. In part, this is because student behavior is so varied: some buy used, rent, unbundle, share, sell back, order overseas, pirate, or skip a purchase altogether, and pricing for every option can change from one day to the next. Having a savings estimate helps us understand the scope of the impact for students.
Related posts:
- Estimated 2017-19 Student Savings in No-Cost/Low-Cost Courses
- Estimated 2019-21 Student Savings in No-Cost/Low-Cost Courses
- Support for a local approach to data collection
- Estimating student savings from no-cost/low-cost course materials
2021-23 Statewide Savings Estimate
Out of Oregon’s 24 public community colleges and universities, 20 provided data for this report: 13 community colleges and 7 universities. Four community colleges did not participate this year.
Student enrollment is represented by 2022 Fall, Fourth Week Headcount data provided by the Higher Education Coordinating Commission Office of Research and Data. Fall, fourth week enrollment is the data that is provided by both community colleges and universities; using headcount rather than full-time equivalent shows how many individual students may see impact from no-cost/low-cost courses.
- 2022 Fall, Fourth Week Headcount Enrollment for the participating institutions: 169,394
- 2022 Fall, Fourth Week Headcount Enrollment for all Oregon community colleges and universities: 181,690
The institutions that shared data for this report represent over 90% of the students in the state. The courses with the no-cost and low-cost designation in the schedule at these institutions are estimated to have saved 900,000 students in 50,000 course sections ~$70 million in two academic years. At the reporting institutions, 30% of courses offered were designated no-cost or low-cost.
| Term | # Designated Sections* | # Students in Designated Sections | Estimated Savings* | Total sections offered | % no-cost/low-cost |
|---|---|---|---|---|---|
| Summer 2021 | 1,789 | 30,569 | 2,246,658 | 8,118 | 22.04 |
| Fall 2021 | 5,938 | 111,714 | 8,540,663 | 23,884 | 24.86 |
| Winter 2022 | 7,152 | 128,692 | 9,523,227 | 23,195 | 30.83 |
| Spring 2022 | 6,999 | 126,025 | 9,789,397 | 23,854 | 29.34 |
| Summer 2022 | 2,211 | 32,037 | 2,527,511 | 7,840 | 28.20 |
| Fall 2022 | 8,451 | 159,746 | 11,934,711 | 23,645 | 35.74 |
| Winter 2023 | 7,897 | 153,494 | 11,764,808 | 23,331 | 33.85 |
| Spring 2023 | 8,787 | 151,121 | 11,638,268 | 24,151 | 36.38 |
| Total | 49,279 | 893,398 | 69,198,844 | 159,460 | 30.90 |
*The total in these columns is greater than the sum of the rows because of differences in institutional data reporting methods.
Comparison with Previous Statewide Savings Estimates
Open Oregon Educational Resources previously reported on statewide estimated student savings represented by Oregon’s no-cost/low-cost course designation in 2019 and 2021. With new data now available for the 2021-23 biennium, it is possible to see trends.
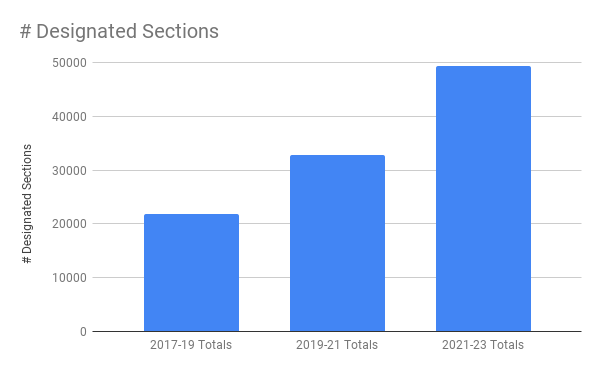
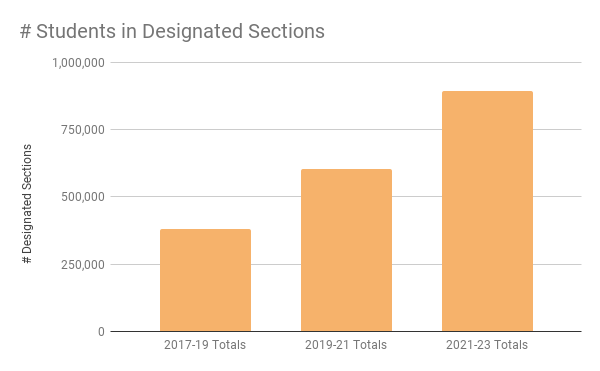
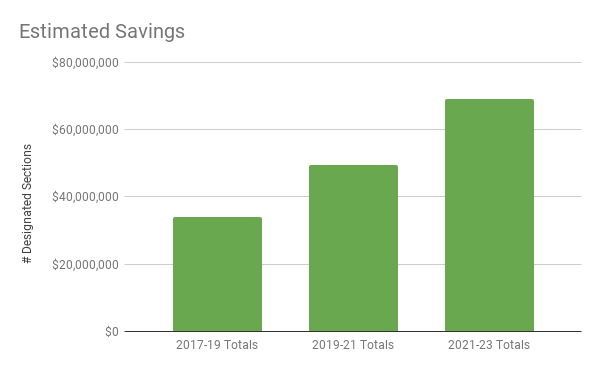
Since the 2017-19 biennium, Oregon’s community colleges and universities have increased the number of courses with the no-cost and low-cost designation in the schedule by 125%, even though the total number of sections offered has dropped by 11% during that time. Similarly, the number of students in those designated sections has increased by 136% while total enrollment has fallen over the same time period. Compared to the 2017-19 biennium, 500,000 additional students enrolled in designated sections and estimated student savings doubled, representing increased savings of over $35 million.
During the six years covered by these reports, courses with the no-cost and low-cost designation in the schedule are estimated to have saved 1.8M students in 100,000 course sections ~$150 million.
| # Designated Sections | # Students in Designated Sections | Estimated Savings | Total sections offered | % no-cost/low-cost | |
|---|---|---|---|---|---|
| 2017-19 Totals | 21,914 | 379,348 | $34,178,056 | 178,815 | 12.26% |
| 2019-21 Totals | 32,737 | 602,646 | $49,392,244 | 171,846 | 19.05% |
| 2021-23 Totals | 49,279 | 893,398 | $69,198,844 | 159,460 | 30.90% |
| Difference from first report to present | +27,365 | +514,050 | +$35,020,788 | -19,355 | +18.64% |
| Percent change from first report to present | +125% | +136% | +102% | -11% | +152% |
Per Institution Breakdown
Oregon institutions are not required to use a consistent method for calculating student savings represented by the statewide no-cost/low-cost schedule designation. Instead, each campus estimates student savings using the method that is the best fit for them, reflecting local needs and decision-making at each campus. The resulting statewide estimate aggregates the data reported irrespective of method; the institutional information detailed below explains the method used at each participating community college or university.
Blue Mountain Community College
Prior to Summer 2022, Blue Mountain Community College did not have the ability to indicate no-cost/low-cost course material courses on our schedule. Beginning in Summer 2022, we implemented the no-cost/low-cost designation and also include a link with the course on the schedule that takes the student to the page for the specific course at our online bookstore.
To remain consistent with our peers, we have used the amount of $100 for calculating the average savings per student. Our extensive adoption of OER as well as the utilization of our inclusive access program are reflected in the high percentage of no-cost/low-cost courses. Non-credit and apprenticeship courses have been excluded from our calculations, as well as art courses requiring art supply kits. Additionally, we removed nursing courses from our calculations as nearly all of the materials for the two year program are purchased in the first term of the first year and would thus skew results. The 2022 Fall, Fourth Week Headcount Enrollment for Blue Mountain Community College was 1,685.
Since the 2017-19 biennium, the percentage of sections with the no-cost and low-cost designation in the schedule at Blue Mountain Community College increased from 26% to 84%.
| Term | # Designated Sections | # Students in Designated Sections | Estimated Savings | Total sections offered | % no-cost/low-cost |
|---|---|---|---|---|---|
| Summer 2022 | 43 | 431 | $43,100 | 50 | 86.00 |
| Fall 2022 | 173 | 2560 | $256,000 | 206 | 83.98 |
| Winter 2023 | 174 | 2199 | $219,900 | 216 | 80.56 |
| Spring 2023 | 158 | 2143 | $214,300 | 183 | 86.34 |
| Total | 548 | 7,333 | $733,300 | 655 | 83.66 |
Central Oregon Community College
The Office of Institutional Effectiveness at Central Oregon Community College provided a spreadsheet with 4th week enrollment numbers for courses with low-cost or no-cost materials. COCC used $100 as the savings estimate for no-cost courses, and $60 as the savings estimate for low-cost courses (because their low-cost threshold is $40). The 2022 Fall, Fourth Week Headcount Enrollment for Central Oregon Community College was 5,394.
While the total number of sections offered at Central Oregon Community College has decreased by 15% since the 2017-19 biennium, the number of sections with the no-cost and low-cost designation in the schedule increased by 12%. Over 4,000 additional students enrolled in designated sections and estimated student savings saw an 8% increase, representing increased savings of $170,000.
| Term | # Designated Sections | # Students in Designated Sections | Estimated Savings | Total sections offered | % no-cost/low-cost |
|---|---|---|---|---|---|
| Summer 2021 | 79 | 2,349 | $84,080 | 183 | 43.17 |
| Fall 2021 | 263 | 4,023 | $344,540 | 681 | 38.62 |
| Winter 2022 | 330 | 4,451 | $377,500 | 686 | 48.10 |
| Spring 2022 | 290 | 3,858 | $339,400 | 700 | 41.43 |
| Summer 2022 | 91 | 970 | $84,480 | 207 | 43.96 |
| Fall 2022 | 254 | 3933 | $334,180 | 685 | 37.08 |
| Winter 2023 | 283 | 4098 | $357,280 | 682 | 41.50 |
| Spring 2023 | 294 | 4026 | $350,360 | 691 | 42.55 |
| Total | 1884 | 27,708 | $2,271,820 | 4515 | 41.73 |
Chemeketa Community College
Chemeketa Community College previously used $100 as the savings estimate for no-cost courses, and $60 as the savings estimate for low-cost courses because their low-cost threshold was $40. To represent savings during the 2021-23 biennium, they opted to use three different methods:
- For Summer 2021, Chemeketa Community College used $100 as the savings estimate for no-cost courses and $50 as the savings estimate for low-cost courses because their low-cost threshold was $50.
- For Fall 2021, Winter 2022, and Spring 2022, Chemeketa Community College provided all digital materials at no cost. Calculations were based on 100% savings from actual costs.
- For Summer 2022, Fall 2022, Winter 2023, and Spring 2023, Chemeketa Community College used $100 as the savings estimate for no-cost courses and $100 minus the actual cost as the savings estimate for low-cost courses (ex: if a book was $20, the calculated savings was $80).
The 2022 Fall, Fourth Week Headcount Enrollment for Chemeketa Community College was 9,462.
Compared to the 2019-21 biennium, almost 24,000 additional Chemeketa Community College students enrolled in designated sections and estimated student savings saw an 8% increase, representing increased savings of nearly $500,000.
| Term | # Designated Sections | # Students in Designated Sections | Estimated Savings | Total sections offered | % no-cost/low-cost |
|---|---|---|---|---|---|
| Summer 2021 | 159 | 1,915 | $143,202.36 | 356 | 44.66 |
| Fall 2021 | 1,122 | 18,366 | $1,182,937.64 | 1,122 | 100.00 |
| Winter 2022 | 1,054 | 17,751 | $1,221,636.05 | 1,054 | 100.00 |
| Spring 2022 | 1,027 | 16,627 | $1,184,202.68 | 1,027 | 100.00 |
| Summer 2022 | 147 | 1,888 | $140,743.09 | 303 | 48.51 |
| Fall 2022 | 693 | 12,340 | $933,805.91 | 1,127 | 61.49 |
| Winter 2023 | 679 | 11,993 | $950,762.40 | 1,062 | 63.94 |
| Spring 2023 | 694 | 11,358 | $921,869.82 | 1,246 | 55.70 |
| Total | 5,575 | 92,238 | $6,679,159.95 | 7,297 | 76.40 |
Clackamas Community College
The data includes all active course sections that were offered for at least 1 credit in all relevant terms.
We estimated savings by comparing the average cost of course materials for 2021-23 terms to the average cost of course materials in the most-recent like terms before LCT designation was added to the schedule of classes, which we called our comparison terms (Winter 2017, Spring 2017, Summer 2017, Fall 2017).
We calculated estimated savings by completing the following steps:
- Calculating the average minimum required course material cost for all LCT-designated course sections for Summer 2021, Fall 2021, Winter 2022, Spring 2022, Summer 2022, Fall 2022, Winter 2023, and Spring 2023 terms.
- Calculating the average minimum required course material cost for all course sections in each of our comparison terms (Winter 2017, Spring 2017, Summer 2017, Fall 2017).
- Finding the difference between the average minimum required course material cost for the 2021-23 terms and the like comparison term (i.e. using Summer 2017 for Summer 2021-23 terms, Fall 2017 for Fall 2021-23 and so on).
- The estimated savings was then determined by multiplying the difference in average minimum required cost by the number of students enrolled in LCT-designated course sections for 2021-23 terms.
The 2022 Fall, Fourth Week Headcount Enrollment for Clackamas Community College was 6,954.
While the total number of sections offered at Clackamas Community College has decreased by 10% since the 2017-19 biennium, the number of sections with the no-cost and low-cost designation in the schedule increased by 63%. Estimated student savings saw an 89% increase, representing increased savings of $420,000.
| Term | # Designated Sections | # Students in Designated Sections | Estimated Savings | Total sections offered | % no-cost/low-cost |
|---|---|---|---|---|---|
| Summer 2021 | 86 | 896 | $34,047.91 | 299 | 28.76 |
| Fall 2021 | 336 | 3,531 | $128,069.71 | 1,122 | 29.95 |
| Winter 2022 | 346 | 3,404 | $140,586.64 | 1,048 | 33.02 |
| Spring 2022 | 364 | 3,140 | $95,593.25 | 1,274 | 28.57 |
| Summer 2022 | 101 | 968 | $42,764.88 | 270 | 37.41 |
| Fall 2022 | 434 | 4,656 | $172,928.72 | 1,118 | 38.82 |
| Winter 2023 | 399 | 4,239 | $174,801.97 | 1,058 | 37.71 |
| Spring 2023 | 393 | 3,703 | $109,220.81 | 1,269 | 30.97 |
| Total | 2459 | 24537 | $898,013.89 | 7458 | 32.97 |
Clatsop Community College
Our methodology was to start with the textbook adoptions reported to the bookstore and identify the no cost classes and those with costs at $40 or under. We pulled enrollment data for each class section but did not include students who dropped out of the classes. For each student in a no-cost class, we estimated $100 in savings, for each student in a low-cost class, we estimated $60 in savings. The 2022 Fall, Fourth Week Headcount Enrollment for Clatsop Community College was 901.
Since the 2017-19 biennium, the number of Clatsop Community College students enrolled in sections with the no-cost and low-cost designation in the schedule has increased by 87%. Over 1,200 additional students enrolled in designated sections and estimated student savings saw a 103% increase, representing increased savings of $109,000.
| Term | # Designated Sections | # Students in Designated Sections | Estimated Savings | Total sections offered | % no-cost/low-cost |
|---|---|---|---|---|---|
| Summer 2021 | 22 | 201 | $15,660 | 50 | 44.00 |
| Fall 2021 | 19 | 290 | $24,280 | 184 | 10.33 |
| Winter 2022 | 21 | 258 | $18,480.00 | 190 | 11.05 |
| Spring 2022 | 23 | 204 | $17,400.00 | 173 | 13.29 |
| Summer 2022 | 20 | 150 | 11680 | 49 | 40.82 |
| Fall 2022 | 29 | 427 | 35740 | 184 | 15.76 |
| Winter 2023 | 22 | 476 | 42520 | 202 | 10.89 |
| Spring 2023 | 29 | 624 | 49,040 | 197 | 14.72 |
| Total | 185 | 2630 | $214,800 | 1229 | 15.05 |
Columbia Gorge Community College
Columbia Gorge Community College uses the $100 multiplier to estimate savings. No-cost/low cost sections offered that didn’t fill were counted towards designated sections, though they didn’t result in student savings. The 2022 Fall, Fourth Week Headcount Enrollment for Columbia Gorge Community College was 733.
Since the 2017-19 biennium, the number of Columbia Gorge Community College students enrolled in sections with the no-cost and low-cost designation in the schedule has increased by 11%. Over 700 additional students enrolled in designated sections and estimated student savings saw a 27% increase, representing increased savings of $170,000.
| Term | # Designated Sections | # Students in Designated Sections | Estimated Savings | Total sections offered | % no-cost/low-cost |
|---|---|---|---|---|---|
| Summer 2021 | 26 | 322 | $32,200.00 | 36 | 72.22 |
| Fall 2021 | 53 | 1,814 | $181,400.00 | 139 | 38.13 |
| Winter 2022 | 60 | 1,686 | $168,600.00 | 148 | 40.54 |
| Spring 2022 | 57 | 1,640 | $164,000.00 | 164 | 34.76 |
| Summer 2022 | 24 | 182 | $18,200.00 | 36 | 66.67 |
| Fall 2022 | 58 | 1,302 | $130,200.00 | 126 | 46.03 |
| Winter 2023 | 55 | 588 | $58,800.00 | 123 | 44.72 |
| Spring 2023 | 64 | 485 | $48,500.00 | 163 | 39.26 |
| Total | 397 | 8,019 | $801,900.00 | 935 | 42.46 |
Eastern Oregon University
Savings are calculated by assuming an average savings of $100 per enrollment for zero cost sections and of $50 per enrollment for low cost sections. The 2022 Fall, Fourth Week Headcount Enrollment for Eastern Oregon University was 2,674. Data for previous bienniums was not comparable.
| Term | # Designated Sections | # Students in Designated Sections | Estimated Savings | Total sections offered | % no-cost/low-cost |
|---|---|---|---|---|---|
| Summer 2021 | 85 | 1,022 | $85,150 | 224 | 37.95 |
| Fall 2021 | 341 | 4,057 | $366,050 | 693 | 49.21 |
| Winter 2022 | 358 | 4,138 | $371,400 | 705 | 50.78 |
| Spring 2022 | 297 | 3,366 | $290,400 | 730 | 40.68 |
| Summer 2022 | 98 | 1103 | $90,450 | 210 | 46.67 |
| Fall 2022 | 345 | 3,820 | $340,400 | 693 | 49.78 |
| Winter 2023 | 350 | 3,579 | $314,100 | 709 | 49.37 |
| Spring 2023 | 414 | 4,281 | $380,850 | 716 | 57.82 |
| Total | 2288 | 25,366 | $2,238,800 | 4680 | 48.89 |
Linn-Benton Community College
At Linn-Benton Community College, a course must have materials costs at $40 or less to be considered low-cost and receive the low-cost designation in the schedule. We use the $100 metric as the average estimated student cost savings when an instructor adopts OER or free resources. We only report on credit-bearing courses.
Gaps and inaccuracies may be present in this reporting for several reasons:
- We used multiple data sources which may or may not have perfect accuracy
- We aren’t sure whether faculty are accurately reporting OER adoptions
- We don’t know the real savings represented by low-cost courses
- Key positions experienced turnover that impacted data collection and analysis.
In sum, we are probably under-reporting student savings represented by the no-cost/low-cost schedule designation. The 2022 Fall, Fourth Week Headcount Enrollment for Linn-Benton Community College was 6,216.
| Term | # Designated Sections | # Students in Designated Sections | Estimated Savings | Total sections offered | % no-cost/low-cost |
|---|---|---|---|---|---|
| Summer 2021 | 46 | 565 | $4,320.00 | 456 | 10.09 |
| Fall 2021 | 231 | 2,256 | $21,700.00 | 1452 | 15.91 |
| Winter 2022 | 286 | 2,592 | $25,600.00 | 1505 | 19.00 |
| Spring 2022 | 2 | 18 | $200.00 | 1984 | 0.10 |
| Summer 2022 | 13 | 132 | $1,220.00 | 444 | 2.93 |
| Fall 2022 | 138 | 1260 | $13,480.00 | 1419 | 9.73 |
| Winter 2023 | 55 | 609 | $5,140.00 | 1421 | 3.87 |
| Spring 2023 | 405 | 3048 | $34,500.00 | 1955 | 20.72 |
| Total | 1176 | 10,480 | $106,160.00 | 10636 | 11.06 |
Mt. Hood Community College
Estimated savings are calculated using the No-Cost/Low-Cost designation that faculty reported on the Course Section Reporting Form (CSRF). We assumed a cost savings to the student of $100 in no-cost sections and $75 in low-cost sections.
The accuracy of our data relies upon input by individual instructors submitting the CSRF. Frequent reminders from the OER coordinator to faculty to submit the form correlate with higher rates of CSRF submission and higher counts of course sections and enrollment. During this biennium the position for OER coordinator was unfilled from the Fall 2021 to Spring 2022. So, it is likely that some if not all terms are underrepresented, and thus savings for students are undercounted. The 2022 Fall, Fourth Week Headcount Enrollment for Mt. Hood Community College was 7,006.
While the total number of sections offered at Mt. Hood Community College decreased by 81% compared to the 2017-19 biennium, the number of sections with the no-cost and low-cost designation in the schedule increased by 73%. Over 4400 additional students enrolled in designated sections and estimated student savings saw an 18% increase, representing increased savings of $195,000.
| Term | # Designated Sections | # Students in Designated Sections | Estimated Savings | Total sections offered | % no-cost/low-cost |
|---|---|---|---|---|---|
| Summer 2021 | 39 | 566 | n/a | n/a | n/a |
| Fall 2021 | 117 | 1,947 | n/a | n/a | n/a |
| Winter 2022 | 80 | 1,161 | n/a | n/a | n/a |
| Spring 2022 | 97 | 1,478 | n/a | n/a | n/a |
| Summer 2022 | 98 | 1036 | n/a | n/a | n/a |
| Fall 2022 | 298 | 4269 | n/a | n/a | n/a |
| Winter 2023 | 235 | 3128 | n/a | n/a | n/a |
| Spring 2023 | 185 | 2231 | n/a | n/a | n/a |
| Total | 1149 | 15,816 | $1,233,600 | 1442 | 79.68 |
Oregon Institute of Technology
Oregon Tech uses $163 as the savings number for no-cost courses because that is the average cost of textbooks that have been converted in the internal initiatives program. Oregon Tech’s low-cost threshold is $50, so the estimated savings for low-cost courses is $113 ($163-$50). The 2022 Fall, Fourth Week Headcount Enrollment for Oregon Institute of Technology was 4,913. Data for previous bienniums was not comparable.
| Term | # Designated Sections | # Students in Designated Sections | Estimated Savings | Total sections offered | % no-cost/low-cost |
|---|---|---|---|---|---|
| Summer 2021 | 164 | 1,263 | $199,119.00 | 330 | 49.70 |
| Fall 2021 | 633 | 7,975 | $1,245,775.00 | 1082 | 58.50 |
| Winter 2022 | 585 | 7,041 | $1,098,383.00 | 1015 | 57.64 |
| Spring 2022 | 641 | 7,295 | $1,132,685.00 | 1010 | 63.47 |
| Summer 2022 | 149 | 1,281 | $200,353.00 | 263 | 56.65 |
| Fall 2022 | 630 | 7667 | $1,192,771.00 | 1054 | 59.77 |
| Winter 2023 | 632 | 7436 | $1,151,968.00 | 992 | 63.71 |
| Spring 2023 | 629 | 7,604 | $1,195,852.00 | 955 | 65.86 |
| Total | 4063 | 47,562 | $7,416,906.00 | 6701 | 60.63 |
Oregon State University
To estimate the cost savings, Oregon State University uses $75 as the average per textbook for no-cost courses in order to reflect more accurately the fact that many students rent, buy used, or rely on the library course reserves materials to acquire their textbook (OpenStax lowered their “lower-end” number to $79 to reflect the national textbook cost data). OSU uses $40 for low-cost courses. Thesis, dissertation and research sections were not counted. The 2022 Fall, Fourth Week Headcount Enrollment for Oregon State University was 35,239.
While the total number of sections offered at Oregon State University decreased by 39% compared to the 2017-19 biennium, the number of sections with the no-cost and low-cost designation in the schedule increased by 478%. Over 145,000 additional students enrolled in designated sections and estimated student savings saw a 541% increase, representing increased savings of $8.7M.
| Term | # Designated Sections | # Students in Designated Sections | Estimated Savings | Total sections offered | % no-cost/low-cost |
|---|---|---|---|---|---|
| Summer 2021 | 303 | 7,575 | $449,725 | 1,046 | 28.97 |
| Fall 2021 | 670 | 21,427 | $1,241,545 | 2,867 | 23.37 |
| Winter 2022 | 779 | 24,045 | $1,443,975 | 2,909 | 26.78 |
| Spring 2022 | 808 | 23,868 | $1,488,060 | 2,826 | 28.59 |
| Summer 2022 | 370 | 8,886 | $531,130 | 1,113 | 33.24 |
| Fall 2022 | 913 | 30,865 | $1,815,875 | 2,926 | 31.20 |
| Winter 2023 | 920 | 31,888 | $1,916,360 | 2,981 | 30.86 |
| Spring 2023 | 771 | 25,532 | $1,526,140 | 2,897 | 26.61 |
| Total | 5534 | 174,086 | $10,412,810 | 19,565 | 28.29 |
Portland Community College
Savings are estimates and use $100 text cost as per Open Oregon Educational Resources’s suggestion in Estimating student savings from no-cost/low-cost course materials. The 2022 Fall, Fourth Week Headcount Enrollment for Portland Community College was 25,263.
While the total number of sections offered at Portland Community College decreased by 29% compared to the 2017-19 biennium, the number of sections with the no-cost and low-cost designation in the schedule increased by 18%. Over 22,000 additional students enrolled in designated sections and estimated student savings saw a 28% increase, representing increased savings of $2.3M.
| Term | # Designated Sections | # Students in Designated Sections | Estimated Savings | Total sections offered | % no-cost/low-cost |
|---|---|---|---|---|---|
| Summer 2021 | 424 | 6,791 | $631,060 | 1,952 | 21.72 |
| Fall 2021 | 1060 | 18,688 | $1,716,720 | 3,925 | 27.01 |
| Winter 2022 | 1047 | 17,723 | $1,618,980 | 3,836 | 27.29 |
| Spring 2022 | 955 | 15,517 | $1,432,940 | 3,931 | 24.29 |
| Summer 2022 | 372 | 5,466 | $507,960 | 1,855 | 20.05 |
| Fall 2022 | 1014 | 16,354 | $1,529,800 | 4,138 | 24.50 |
| Winter 2023 | 1012 | 16,434 | $1,563,880 | 4,173 | 24.25 |
| Spring 2023 | 1105 | 16,616 | $1,569,360 | 4,049 | 27.29 |
| Total | 6989 | 113,589 | $10,570,700 | 27,859 | 25.09 |
Portland State University
Portland State University began reporting on courses with the no-cost designation in the 2017-19 biennium. The low-cost designation was implemented in Fall 2022.
- For Summer 2021, Fall 2021, Winter 2022, Spring 2022, and Summer 2022, we are reporting no-cost data.
- For Fall 2022, Winter 2023, and Spring 2023, we are reporting both no-cost and low-cost data.
Starting with this biennium, PSU is following the common method of using $100 as the savings estimate for no-cost courses, and $60 as the savings estimate for low-cost courses (because our low-cost threshold is $40). We used 4th week enrollment numbers to calculate the number of students in designated sections.
To arrive at the total number of for-credit sections offered, we excluded ‘noise’ to generate both the numerator and denominator for this calculation. We consider ‘noise’ to be those odd, irregular courses/populations where it is not typical or expected that there will be textbooks required at all, or the engagement with the faculty is one-on-one/and customized. We exclude the following:
- High School Dual Credit
- By-Arrangement – one-on-one faculty-student arrangements
- Study Abroad
- PE – activity
- Thesis/Dissertation
- Internship/Coop
- Workshop
- Practicum
- Reading and Conference – 405/505/605
- Independent Study
- Research
The 2022 Fall, Fourth Week Headcount Enrollment for Portland State University was 22,014. Data for previous bienniums was not comparable.
| Term | # Designated Sections | # Students in Designated Sections | Estimated Savings | Total sections offered | % no-cost/low-cost |
|---|---|---|---|---|---|
| Summer 2021 | 84 | 1,850 | $185,000 | 816 | 10.29 |
| Fall 2021 | 240 | 5,518 | $551,800 | 2,786 | 8.61 |
| Winter 2022 | 234 | 4,086 | $408,600 | 2,778 | 8.42 |
| Spring 2022 | 251 | 4,761 | $476,100 | 2,600 | 9.65 |
| Summer 2022 | 80 | 1,432 | $143,200 | 752 | 10.64 |
| Fall 2022 | 503 | 13,193 | $1,189,700 | 2,531 | 19.87 |
| Winter 2023 | 499 | 11,647 | $1,048,220 | 2,476 | 20.15 |
| Spring 2023 | 489 | 11,102 | $1,013,560 | 2,451 | 19.95 |
| Total | 2,380 | 53,589 | $5,016,180 | 17,190 | 13.85 |
Rogue Community College
To estimate student savings at Rogue Community College from designated no-cost/low-cost course designations on the schedule, we ran a report on the sections that were flagged the “no-cost/low-cost” designation in the institution’s management system, RogueNet. For the headcount, we use the estimated figure of 25 students per section.
We used the established figure of $100 as the cost of a traditional textbook to compare to no-cost/low-cost textbooks. RogueNet allows us to distinguish “low cost” and “no cost” classes as separate categories, so we can accurately say which classes are low cost and which are no cost. The 2022 Fall, Fourth Week Headcount Enrollment for Rogue Community College was 4,245.
To capture a range of the estimated student savings for no-cost textbooks and low-cost textbooks, we multiplied the estimated number of enrolled students (25 per section) by:
- $60 which represents what students save when they purchase a low-cost textbook defined as $40 and under. Sixty is the most conservative figure to use to estimate savings for a low-cost textbook.
- $100 which represents what students save when they use open educational resources and/or no textbook is required for the class.
| Term | # Designated Sections | # Students in Designated Sections | Estimated Savings | Total sections offered | % no-cost/low-cost |
|---|---|---|---|---|---|
| Summer 2021 | 73 | 1825 | $175,500 | 207 | 35.27 |
| Fall 2021 | 130 | 3250 | $286,000 | 516 | 25.19 |
| Winter 2022 | 96 | 2400 | $212,000 | 509 | 18.86 |
| Spring 2022 | 301 | 7525 | $656,500 | 517 | 58.22 |
| Summer 2022 | 94 | 2350 | $209,000.00 | 195 | 48.21 |
| Fall 2022 | 211 | 5275 | $472,500.00 | 533 | 39.59 |
| Winter 2023 | 216 | 5400 | $473,000.00 | 504 | 42.86 |
| Spring 2023 | 312 | 7800 | $720,000.00 | 514 | 60.70 |
| Total | 1433 | 35825 | $3,204,500 | 3495 | 41.00 |
Southern Oregon University
The Office of Institutional Research at Southern Oregon University provided a spreadsheet with 4th week enrollment numbers for courses with low-cost or no-cost course material designations. The low-cost designation is used at SOU when all required course materials total less than $50. To determine our savings estimate, SOU used $100 per student for zero-cost sections and $50 per student for low-cost sections, which is similar to the methods of other Oregon universities for determining the estimated student savings/student cost avoidance data. We expect these student savings estimates to grow as our campus outreach increases along with more consistent use of the course designations. The 2022 Fall, Fourth Week Headcount Enrollment for Southern Oregon University was 5,156.
Data for the 2019-2021 biennium was not available because although SOU had the course designations in place, more outreach on campus was needed for the designations to be applied accurately and consistently.
| Term | # Designated Sections | # Students in Designated Sections | Estimated Savings | Total sections offered | % no-cost/low-cost |
|---|---|---|---|---|---|
| Summer 2021 | 0 | 0 | $0 | 289 | 0.00 |
| Fall 2021 | 29 | 625 | $47,000 | 1036 | 2.80 |
| Winter 2022 | 223 | 2847 | $197,650 | 815 | 27.36 |
| Spring 2022 | 152 | 2062 | $148,300 | 896 | 16.96 |
| Summer 2022 | 9 | 149 | $8,250.00 | 279 | 3.23 |
| Fall 2022 | 161 | 2688 | $191,400.00 | 914 | 17.61 |
| Winter 2023 | 83 | 1237 | $90,400.00 | 973 | 8.53 |
| Spring 2023 | 100 | 1380 | $98,600.00 | 980 | 10.20 |
| Total | 757 | 10988 | $781,600 | 6182 | 12.25 |
Southwestern Oregon Community College
Southwestern Oregon Community College’s institutional researcher prepared a report showing all classes marked as LC or NC in the student information system (Jenzabar), along with student enrollments per section. SOCC used $100 as the savings estimate for no-cost courses, and $50 as the savings estimate for low-cost courses (because their low-cost threshold is $50). The 2022 Fall, Fourth Week Headcount Enrollment for Southwestern Oregon Community College was 2,180.
The total number of sections offered at Southwestern Oregon Community College increased by 34% compared to the 2017-19 biennium, and the percentage of sections with the no-cost and low-cost designation in the schedule increased by 134%. Approximately 6,800 additional students enrolled in designated sections and estimated student savings saw a 128% increase, representing increased savings of $494,550.
| Term | # Designated Sections | # Students in Designated Sections | Estimated Savings | Total sections offered | % no-cost/low-cost |
|---|---|---|---|---|---|
| Summer 2021 | 49 | 881 | $55,650 | 93 | 52.69 |
| Fall 2021 | 118 | 1824 | $124,800 | 286 | 41.26 |
| Winter 2022 | 131 | 1892 | $134,850 | 318 | 41.19 |
| Spring 2022 | 93 | 1,502 | $105,250 | 310 | 30.00 |
| Summer 2022 | 33 | 464 | $30,650 | 67 | 49.25 |
| Fall 2022 | 124 | 2060 | $152,000 | 266 | 46.62 |
| Winter 2023 | 95 | 1436 | $107,600 | 294 | 32.31 |
| Spring 2023 | 163 | 2243 | $170,500 | 304 | 53.62 |
| Total | 806 | 12302 | $881,300 | 1938 | 41.59 |
Tillamook Bay Community College
No-cost resources include OER or instructor provided resources. Low-cost includes courses with textbook costs under $35.00, as that was the threshold used the last time the low-cost icon appeared in the print catalog.
- Included the resource cap: textbooks, workbooks, lab manuals, online homework platforms, access codes, and curriculum materials from publishers. For example, the Math 099 Aleks courses are not counted because students pay a platform fee.
- Not included in the resource cap: equipment and supplies costs or course fees. So art and welding courses are included if they have a supplies fee greater than $35 but no book fee.
Currently the cost designation status icons are not being used in our online catalog, although it does mention if the textbook is an OER. During the biennium the icons were used sporadically in our printed catalog. So the list of courses was built from the printed catalog, and library records of what courses were OER/no-cost. A few additional courses were likely low-cost, but as no icon appeared in the printed catalog and data wasn’t reported to the bookstore or library, those savings aren’t counted.
Notes on savings calculations:
- One-credit Math Corequisites and PE courses were assigned an average cost of 25 dollars, which will need to be refined in the future.
- Textbook costs were estimated in several ways:
- Using past data collection on commercial adoptions prior to switching to no-cost/low-cost option
- Looking at what textbook was used in the past, then calculating the cost for the most recent edition on the publisher’s website
- Looking at the most commonly used textbook on Amazon and seeing what the publisher charged for it
- When all of those options failed, the common estimate of $100 was used for no-cost courses (Is the average cost of a textbook $100?).
For the next biennium, two changes will be made to streamline the process. A flat rate textbook cost will be used for no-cost courses, and another for low-cost courses. And the $100 cost may be revised downwards after more research.
To count enrollment, we:
- Did not count dual enrolled sections, community education, ABE/GED or ESOL
- Did not count canceled courses or students who dropped
- Enrollment data was pulled for each low-cost/no-cost section from the end of term count, except Spring 2023, which used the 4th week figure.
The 2022 Fall, Fourth Week Headcount Enrollment for Tillamook Bay Community College was 784. Data for previous bienniums was not comparable.
| Term | # Designated Sections | # Students in Designated Sections | Estimated Savings | Total sections offered | % no-cost/low-cost |
|---|---|---|---|---|---|
| Summer 2021 | 23 | 144 | $14,583 | 38 | 60.53 |
| Fall 2021 | 41 | 474 | $52,086 | 85 | 48.24 |
| Winter 2022 | 48 | 441 | $47,048 | 86 | 55.81 |
| Spring 2022 | 49 | 429 | $49,056 | 89 | 55.06 |
| Summer 2022 | 19 | 133 | $11,990.00 | 30 | 63.33 |
| Fall 2022 | 43 | 404 | $44,467.00 | 73 | 58.90 |
| Winter 2023 | 51 | 389 | $41,595.00 | 83 | 61.45 |
| Spring 2023 | 51 | 403 | $42,234.00 | 85 | 60.00 |
| Total | 325 | 2,817 | $303,059 | 569 | 57.12 |
Treasure Valley Community College
Treasure Valley Community College used $100 as the savings estimate for no-cost courses, and $40 as the savings estimate for low-cost courses because their low-cost threshold is $60. The 2022 Fall, Fourth Week Headcount Enrollment for Treasure Valley Community College was 1,621.
While the total number of sections offered at Treasure Valley Community College decreased by 47% compared to the 2017-19 biennium, the number of sections with the no-cost and low-cost designation in the schedule increased by 49%. Over 9500 additional students enrolled in designated sections and estimated student savings saw a 543% increase, representing increased savings of nearly $1M.
| Term | # Designated Sections | # Students in Designated Sections | Estimated Savings | Total sections offered | % no-cost/low-cost |
|---|---|---|---|---|---|
| Fall 2021 | 126 | 1591 | $135,040 | 485 | 25.98 |
| Winter 2022 | 111 | 1963 | $156,940 | 470 | 23.62 |
| Spring 2022 | 169 | 1,782 | $143,220 | 457 | 36.98 |
| Summer 2022 | 63 | 627 | $159,980 | 167 | 37.72 |
| Fall 2022 | 173 | 2264 | $197,060 | 467 | 37.04 |
| Winter 2023 | 167 | 2077 | $167,560 | 436 | 38.30 |
| Spring 2023 | 172 | 2153 | $168,860 | 429 | 40.09 |
| Total | 981 | 12457 | $1,128,660 | 2911 | 33.70 |
University of Oregon
The University of Oregon implemented the low/no cost designation in 2018, and we continue to improve the designation and process over time. In the last academic year, we’ve added a filter to our Class Schedule that allows students to search by and filter courses designated as low and no-cost.
For the 2021-2023 biennium, we decided to use our same calculation method as the previous 2019-2021 biennium with some additional context to our data, detailed below.
Formula: ($75 – Actual Cost) * Actual Enrollment = Cost Avoidance
To calculate this data, the Duck Store, our campus bookstore, generates a list of all combined course materials costs with a snapshot of actual student enrollment numbers at the start of each term. We know that some enrollment numbers may change slightly, but this snapshot gives us a pretty good estimate for student enrollment numbers to understand the impact of the schedule designation. This list specifies which courses have been marked as low/no-cost on the Class Schedule, which we currently define as $50 or less. This includes classes that are using library materials, Open Educational Resources, other free or low-cost materials, optional/recommended materials, as well as those that the faculty member has indicated to the Duck Store as “no course materials required.”
We continue to frame this data as “cost avoidance” instead of savings, since the data does not represent student behavior. In other words, we don’t currently yet know if students purchase required materials, where they purchase them, what format (new, used, rental), and how much they spend, and we also don’t know if they use the designator to only register for courses that are low/no cost. Because of this, we think of the data as a representation of the costs we could help students avoid, but not necessarily dollars saved.
We continue to use $75 as the average cost of a book, which aligns with OpenStax’s recommended revision of the national average cost of a textbook. In time and with the increased reporting rates due to the implementation of HB 2919, we have considered using our UO specific average, but we’d like to collect more data to understand this institutional average before we modify our calculation method for future reporting periods.
In the previous 2019-2021 biennium, we only had an average of 30% of faculty reporting adoptions to the Duck Store each term, so we estimated our cost avoidance at $2,466,092.47 in 1,625 low/no cost course designated sections.
In this biennium, as we implemented our Textbook Affordability Plan, we saw our reporting rates increase to 45% in Winter 2022, and after implementing HB 2919, we saw our reporting rates increase to 67% and eventually to 73% during Spring 2023. Given this, our cost avoidance is understandably much higher than the previous biennium, although we think adding some additional context to that data this year is useful.
During the 2021-2023 biennium, 8,952 sections were marked as low/no cost in the Schedule, for a total of $12,302,775 in cost avoidance. This includes:
- 3,120 sections using low/no-cost course materials for a total of $5,569,050 cost avoidance
- 5,832 sections marked as “no course materials required” for a total of $6,733,725 in cost avoidance
We chose to separate out these two numbers because right now, courses marked as “no course materials required” may not ever require course materials, so this number isn’t necessarily representative of student savings. That said, we know that some faculty find ways to eliminate course materials costs for their students and use this reporting option, rather than use a reporting option like Canvas readings, library readings, and/or Open Educational Resources. Given this, we still think including these sections in our low/no cost reporting is important, and we hope to increase clarity and accuracy of the data over time in subsequent reporting periods.
| Term | # Designated Sections | # Students in Designated Sections | Estimated Savings | Total sections offered | % no-cost/low-cost |
|---|---|---|---|---|---|
| Summer 2021 | 90 | 1828 | $79,761.05 | 1468 | 6.13 |
| Fall 2021 | 224 | 11130 | $598,120 | 4244 | 5.28 |
| Winter 2022 | 1142 | 27518 | $1,551,498 | 3952 | 28.90 |
| Spring 2022 | 1254 | 28425 | $1,813,290 | 4026 | 31.15 |
| Summer 2022 | 370 | 4197 | $273,160 | 1278 | 28.95 |
| Fall 2022 | 1996 | 40310 | $2,522,504 | 4093 | 48.77 |
| Winter 2023 | 1727 | 40942 | $2,711,021 | 3927 | 43.98 |
| Spring 2023 | 2149 | 41678 | $2,753,421 | 4028 | 53.35 |
Western Oregon University
Combined enrollment numbers for the biennium were provided by the registrar and multiplied by $100. The 2022 Fall, Fourth Week Headcount Enrollment for Western Oregon University was 3,752. Data for the 2017-19 biennium was not available.
While the total number of sections offered at Western Oregon University increased by 15% compared to the 2019-21 biennium, the number of sections with the no-cost and low-cost designation in the schedule increased by 50%. Over 4600 additional students enrolled in designated sections and estimated student savings saw a 30% increase, representing increased savings of $466,000.
| Term | # Designated Sections | # Students in Designated Sections | Estimated Savings | Total sections offered | % no-cost/low-cost |
|---|---|---|---|---|---|
| Summer 2021 | 37 | 576 | 57600 | 275 | 13.45 |
| Fall 2021 | 185 | 2928 | $292,800 | 1179 | 15.69 |
| Winter 2022 | 221 | 3295 | $329,500 | 1171 | 18.87 |
| Spring 2022 | 169 | 2528 | $252,800 | 1140 | 14.82 |
| Summer 2022 | 17 | 192 | $19,200 | 272 | 6.25 |
| Fall 2022 | 261 | 4099 | $409,900 | 1092 | 23.90 |
| Winter 2023 | 243 | 3699 | $369,900 | 1019 | 23.85 |
| Spring 2023 | 210 | 2711 | $271,100 | 1039 | 20.21 |
