Wrapping up an OER grant funding period includes providing information about student savings during the pilot run of the courses redesigned with open educational resources. But savings from the use of OER also compound over time. Posts on Continuing Savings from Past OER Grants describe how cumulative savings grow for the grant cohorts over time.
In the OER grant programs for which prior data is available, the estimated cumulative student savings is $23,080,669, or about $14 in student savings per program dollar spent. Combined with the impact of the 2021-23 grant cohort, which just concluded, overall student savings for the Open Oregon Educational Resources grant program since 2015 is estimated to be $24,352,296, or about $12 in student savings per program dollar spent. In total, over 176,000 students by headcount have taken the 793 courses redesigned with OER through the support of a grant program.
Congratulations to all of Oregon’s OER grantees for their ongoing work on behalf of students!
By the numbers
| Grant Program | Funds Awarded | 2016 Estimated Savings | 2017 Estimated Cumulative Savings | 2019 Estimated Cumulative Savings | 2021 Estimated Cumulative Savings | 2023 Estimated Cumulative Savings | Estimated Cumulative Savings Per $1 Spent |
|---|---|---|---|---|---|---|---|
| HB 2871 Grant Cohort | $322,000 | n/a | n/a | $1,544,201 | $3,639,342 | $4,333,179 | $13.46 |
| 2015 Grant Cohort | $52,098 | $77,234 | $225,449 | $477,409 | $524,011 | $644,611 | $12.37 |
| 2016-17 Grant Cohort | $280,247 | n/a | $1,146,788 | $4,181,463 | $6,250,340 | $8,867,916 | $31.64 |
| 2018-19 Grant Cohort | $498,919 | n/a | n/a | $1,237,839 | $3,695,160 | $5,377,216 | $10.78 |
| 2019-21 Grant Cohort | $468,921 | n/a | n/a | n/a | $2,420,350 | $3,857,747 | $8.23 |
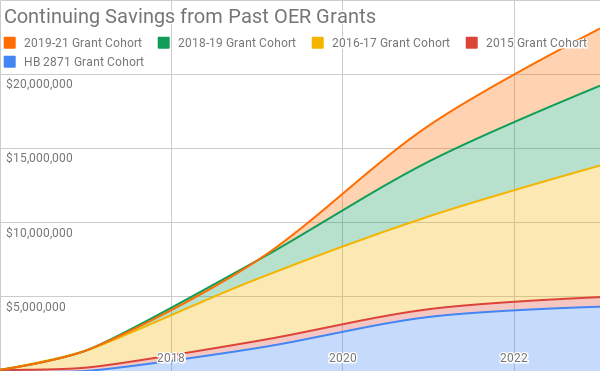
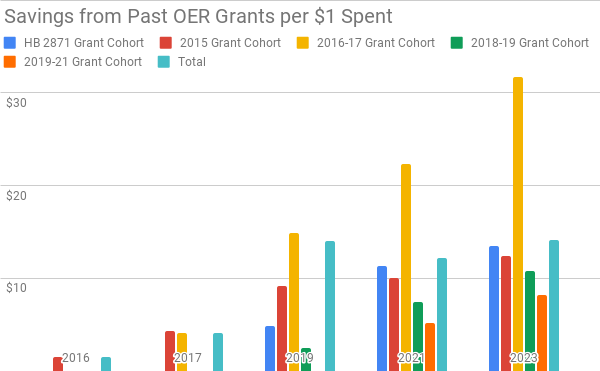
| Total | $1,634,443 | $77,234 | $1,372,237 | $7,440,912 | $16,529,203 | $23,080,669 | $14.12 |
Same data, visual presentation