
Thank you Corey Wetherington, Stephen Krueger, and Katie Winder for reading a draft of this report, and thank you Emily Ford for help wrangling Consumer Price Index data.
Executive Summary
When we talk about the cost of textbooks at Oregon’s community colleges, how much money are we really talking about? In 2015, 2017, and 2019, Open Oregon Educational Resources gathered locally relevant cost data that could be compared across institutions and over time. The results show that over the four years that Oregon has invested statewide funding in textbook affordability, our community colleges have succeeded in reducing the cost of course materials for transfer degrees.
Key takeaways:
- Oregon’s statewide investment in textbook affordability has paid off in lower costs to students at almost every community college.
- Students will have unpredictable experiences of cost for the same curriculum depending on the flexibility of their schedules.
- As we gain evidence that there are viable models to lower costs for students without compromising on quality, colleges will have to reconsider the role of the campus store.
Key findings:
- The average materials cost for the two-year Associate of Arts Oregon Transfer (AAOT) degree in 2019 is $1,492.15, an 18% drop since 2017 and a 30% drop since 2015.
- The 112,462 students in the 10 highest-enrolled courses statewide saved over $1M compared to materials costs in 2017.
- The lowest-cost pathway through the AAOT degree requirements averages $381.24 in course material costs for a two-year degree.
The findings of this ongoing study show that statewide, average materials costs for transfer degrees continue to fall, and that Oregon is well below the national benchmark published by the College Board. Lower textbook costs enable students to redirect funds to help pay for additional courses or living expenses such as food, housing, transportation, or childcare. Prominently designating no-cost and low-cost courses in the schedule enables students to make informed choices as they plan their term. This study demonstrates that students are benefitting from a statewide investment in lowering the cost of course materials. Read the full report.
Background
The present study is the third time that research on the cost of course materials for transfer degrees in Oregon has been undertaken. The 2015 blog post from the beginning of this project, titled Why do we need this research?, argued that Oregon needs local data in order to understand the scope of the problem that our textbook affordability program has set out to solve. In particular, it would be useful to know whether the College Board’s national average recommendation for what students should budget for course materials was applicable in Oregon.
In 2015, Open Oregon Educational Resources gathered baseline data using a research method conceived by Quill West, Pierce College’s Open Education Project Manager, and refined by Nicole Allen, Director of Open Education at SPARC, the Scholarly Publishing & Academic Resources Coalition. What is the cost of course materials for a transfer degree at each community college in Oregon? provides a detailed writeup on the method and results of the first round of research.
The same method was used in a followup study in 2017. The results, shared in Two years and a big difference: Transfer degree course materials costs are down at Oregon’s community colleges, showed that estimated costs fell as textbook affordability initiatives in Oregon’s colleges grew. In addition, by 2017 most Oregon colleges had implemented no-cost and low-cost course material designations in the schedule as a result of HB 2871, so it was possible to determine the lowest-cost pathway through the degree requirements.
Now that the same method has been used three times over four years, it is possible to make a consistent comparison of costs over time – and the results indicate that Oregon’s investment of public funds in textbook affordability is well spent. Commercial textbook prices are dropping in response to market pressures, but the cost of course materials for transfer degrees in Oregon is falling much more steeply, showing the impact of faculty and staff efforts to redesign courses around no-cost and low-cost materials.
Other states and institutions share an interest in establishing local benchmarks for course materials costs. For example, the 2017 slide deck, Establishing the Actual Costs of Textbooks: Data from Virginia’s Community Colleges, shows the results of adopting the SPARC methodology at the statewide level using a sample schedule based on common courses recommended to first-year students by academic advisors. The Penn State Berks Textbook Affordability Dashboard presents information on the cost of all required course materials at one university campus through interactive graphics (documentation available in Details of the Creation of the Penn State Berks Textbook Affordability Dashboard Project). A small liberal-arts college also assessed the course materials costs for every course offered at that institution, as described in the slide deck Assessing Textbook Costs at Randolph College.
Context: Changes Affect Campus Stores
This project would not have been possible without the assistance of all 17 of Oregon’s community college bookstore managers. Each verified the data presented below to ensure the accuracy of the information collected for their colleges. Store managers are essential campus community members who bring expertise in negotiating with publishers, on-demand printing, and compliance with federal reporting requirements in order to support students.
At many institutions, this is a difficult time to be a campus store manager. Reduced revenue calls into question the self-support model that all of Oregon’s stores currently operate under, and has led to several of Oregon’s independent college stores being outsourced in the past year. While the revenue loss began years ago with students using Amazon, Chegg, and other strategies to control spending, campus- and state-led efforts to lower costs also have an impact on the bottom line. Further, commercial publishers steer purchases away from campus stores by direct-marketing to faculty and students, and by offering lower prices directly from publisher websites.
Keeping textbook prices artificially high at the campus store by assigning expensive materials is not a sustainable revenue source. A 2016 Student PIRGs report, Covering the Cost: Why We Can No Longer Afford to Ignore High Textbook Prices, concludes that community college students are more likely to use financial aid to pay for textbooks, and also to use more of their financial aid on textbooks than their university counterparts. It is a more effective use of public funding to support faculty redesigning courses around open or no-cost materials in order to reduce the need for aid and take third-party corporations out of the loop.
It is an essential service for students to find and purchase their course materials where they can use their financial aid and other benefits. But as we gain evidence that there are viable models to dramatically lower costs for students without compromising on quality, colleges will have to reconsider the role of the campus store. A new model may emerge in which the course materials functions of the bookstore are supported by the general fund (that is, covered by the tuition and fees that students already pay for essential services) and the self-support retail model applies only to the supply, gift, and clothing sales functions.
Research Method
This research estimates course materials costs for two of Oregon’s transfer degree programs: Associate of Arts Oregon Transfer (AAOT) and Associate of Science Oregon Transfer-Business (ASOT-BUS). The course requirements for each of the transfer degree programs are specified in the course catalog for each college. In 2015 and 2017, the Associate of Science transfer degree was also included in the analysis, but it was dropped in the present study because it is not consistently offered statewide.
While there are some specific courses required for each degree, there are many possible ways to meet the requirements for disciplinary studies and electives. Therefore, where there were multiple options to meet a requirement, the course with the highest enrollment at that college was selected to fulfill the requirement. Data on course enrollments for each college was provided by the Office of Research and Data of the Oregon Higher Education Coordinating Commission from the most recent year available (2017 for the present study). This research does not suggest a pathway that any individual would take, but rather looks at the courses that students collectively take most often at each college. This is where cost reductions can have the greatest impact.
The next step was to visit each college bookstore’s website and look up the required course materials for each of the courses for the current term. If multiple sections of the course were being taught, the first one on the list was selected. This arbitrary choice accounts for the fact that students often are not able to choose their courses based on cost of materials because of competing priorities such as work schedules or childcare.
For each course, the most and least expensive options for the total cost of materials was recorded. If one book could be used for more than one course in a series, its cost was only counted once. The research method described so far was repeated in 2015, 2017, and 2019 in order to make a consistent comparison.
In addition, one more analysis was added in 2017 and repeated in 2019. Oregon’s HB 2871 (passed in 2015) requires all public colleges and universities to designate no-cost and low-cost courses in the schedule. This policy assumes that students may make course selections based on the cost of materials. 13 out of the 17 colleges had implemented the schedule designation by Fall 2017, and all but one had implemented the designation by Fall 2019. This makes it possible to use the schedule to find the AAOT degree pathway with the lowest possible materials cost. Again, this is not a program that any individual would pursue, but demonstrates the significant cost savings that are possible when students have the information and flexibility to choose the lowest-cost option.
The data supporting the conclusions presented here can be found in the 2019 Aggregate Statewide Data spreadsheet. Data for each college is available in the appendix (available in the full report), and the course/bookstore data for each college is available upon request.
Results
At nearly every college, the cost of materials is down for both degrees included in this study, which reflects the work undertaken over the past four years to lower textbook costs. Choosing the first section of the highest-enrolled courses to meet degree requirements, statewide average costs are:
- AAOT: $1,492.15
- 18% drop since 2017
- 30% drop since 2015
- ASOT-BUS: $1,574.58
- 20% drop since 2017
- 32% drop since 2015
Assuming maximum flexibility to select courses based on materials cost, the average lowest-cost AAOT degree pathway is $381.24. This very low number represents a 75% savings compared to the average cost when always choosing the first section, demonstrating the significant savings that are possible when students have the information and flexibility to choose the lowest-cost option. For the first time, two colleges offered zero-textbook-cost courses that meet all degree requirements (again, not necessarily a pathway that any individual student would take).
However, without department- and institution-wide commitments to low-cost and no-cost materials, students will have unpredictable experiences within the same curriculum. Those with the most flexibility in their schedules will be able to select the sections designated as no-cost or low-cost, while those with the least flexibility may have to pay more for the same course. The zero-textbook-cost pathways through the degree requirements that were identified at two colleges cannot be guaranteed to be available to all students. At the moment, the lowest-cost pathway is a reminder of the impact of faculty choices and the importance of prominently designating courses in the class schedule to make savings information readily available to students. It has the potential to become a curriculum that can be marketed widely to students.
Figure 1, below, shows the statewide average cost of materials for AAOT and ASOT-BUS degrees (averaging the high and low materials costs for the degree) in the three years that data were gathered.
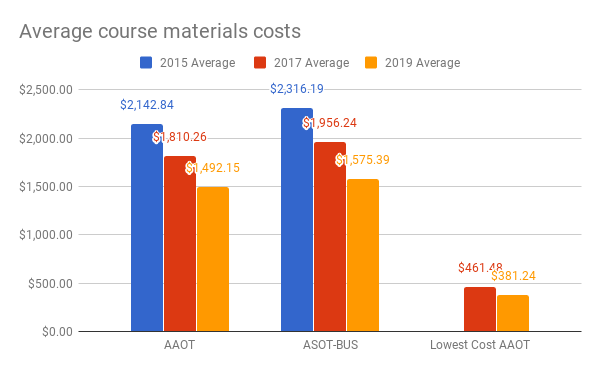
Figure 1: Average course materials costs for AAOT and ASOT-BUS degrees, and lowest-cost AAOT pathway
According to the Oregon Community Colleges Data Mart, 3,567 students completed AAOT degrees in 2018-19 (the most recent year available). An average savings of $318.11 compared to 2017 costs adds up to a statewide estimated savings of $1,134,687.88 for the students that completed their AAOT degree last year. If they were all able to pursue the lowest-cost degree pathway, those graduates would see an additional savings of $3,962,615.97. If compared to the 2015 benchmark, an average savings of $650.69 from 2015 costs adds up to a statewide estimated savings of $2,321,028.02 for those students.
Comparisons With National Metrics
Comparison of these research results to College Board data is not apples-to-apples because the two figures are derived from different methods, but the national data provides a useful point of reference to show that students are seeing a real impact from Oregon’s statewide efforts to lower course materials costs in the colleges. According to the College Board’s Average estimated undergraduate budgets by sector, 2019-20, students at public two-year colleges should budget $1,460 per year for books and supplies. This estimate, which has increased each year, suggests that for a two-year degree students would budget $2,920.
The 2015 study found that the College Board’s national average cost for course materials was a little bit above the average for Oregon’s community college transfer degree students. In 2017, average costs at almost every Oregon community college were under the College Board’s national average. In 2019, with a statewide average cost of course materials for a 2-year AAOT degree at $1,492.15, Oregon’s college students may expect to budget about half of the College Board benchmark. Figure 2 shows how Oregon’s costs are diverging from the national estimate.
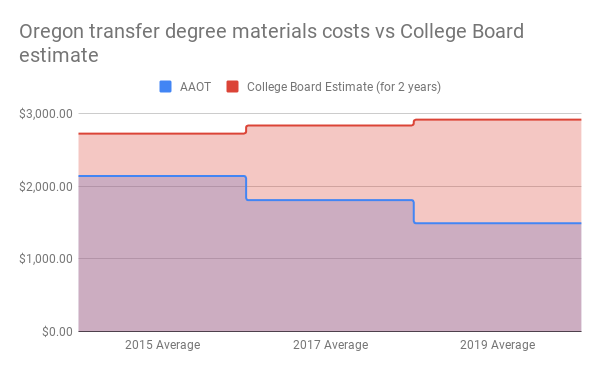
Figure 2: Course materials cost for 2-year transfer degree compared to College Board estimate
This study doesn’t ask what students actually spend (which includes strategies such as sharing, borrowing, pirating, doing without course materials altogether, and so on). In fact, the National Association of College Stores finds that student spending has decreased over the last decade, regardless of whether textbook prices were increasing or decreasing. Rather, this study measures what students are asked to spend by looking at the cost of course materials adopted through the bookstore. While commercial textbook prices have stopped their consistent climb over the past few years, according to the American Enterprise Institute – perhaps in part because of pressure from student activists and the open education movement – the College Board’s estimate continues to rise – perhaps because of inflation or the rising costs of other supplies.
Figure 3 shows that while commercial textbook prices are falling, according to annualized data from the U.S. Bureau of Labor Statistics, price cuts by publishers do not fully account for the decline that Oregon students see. Publisher strategies to lower costs in response to market pressure (“inclusive access” pricing is one example) are contributing to the savings for Oregon’s college students, but faculty choices are having a much bigger impact overall.
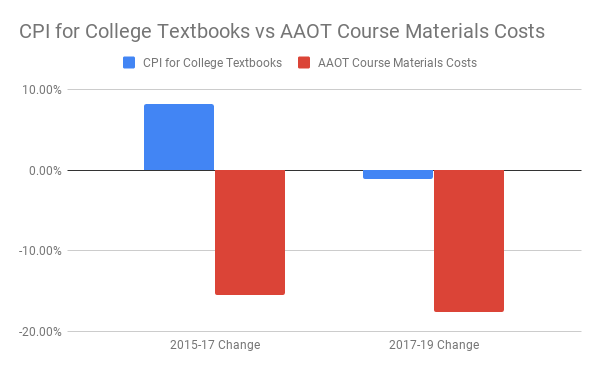
Figure 3: Change in cost for 2-year transfer degree compared to Consumer Price Index
High-enrollment Courses
Many more students take core degree courses than earn a degree in any year. Figure 4, below, shows the drop in the average cost of course materials for the 10 highest-enrolled courses statewide (there was no change in which 10 courses were highest-enrolled between 2017 and 2019).
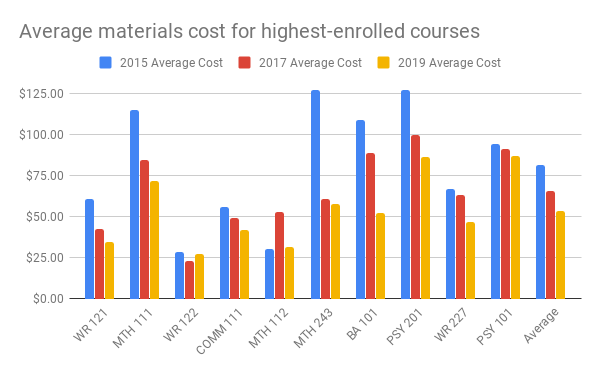
Figure 4: Average materials cost for highest-enrolled courses
Figure 5, below, shows student savings in 2019 compared to 2017 based on average materials costs and headcount enrollment in the 10 highest-enrolled courses. These numbers show that while materials costs for writing courses are generally low, the courses are so highly enrolled that the potential savings could have a high impact. The data also demonstrate that immediate savings can be found by ensuring that courses in sequence, such as MTH 111 and MTH 112, use the same textbook, lowering the effective course materials cost of subsequent courses in the series to zero. Oregon’s college students saved over $1 million in these 10 high-enrollment courses alone compared to 2017 costs, and the potential future savings, as more faculty make the change to OER and lower-cost materials, is over $5 million.
| Course | 2015 Average Cost | 2017 Average Cost | 2019 Average Cost | 2019 Enrollment | Student Savings from 2017-2019 | Potential savings from 2019 |
|---|---|---|---|---|---|---|
| WR 121 | $60.95 | $42.63 | $34.39 | 27,311 | $224,930.18 | $939,225.29 |
| MTH 111 | $114.96 | $84.70 | $71.58 | 17,328 | $227,404.52 | $1,240,307.66 |
| WR 122 | $28.48 | $22.91 | $27.46 | 15,699 | -$71,504.33 | $431,103.77 |
| COMM 111 | $55.94 | $49.16 | $41.87 | 10,961 | $79,879.90 | $458,982.20 |
| MTH 112 | $30.36 | $52.82 | $31.60 | 8,182 | $173,642.58 | $258,540.29 |
| MTH 243 | $127.14 | $60.50 | $57.65 | 7,456 | $21,249.60 | $429,820.86 |
| BA 101 | $108.67 | $88.82 | $52.38 | 7,259 | $264,539.31 | $380,209.34 |
| PSY 201 | $126.82 | $99.50 | $86.08 | 6,163 | $82,757.53 | $530,487.93 |
| WR 227 | $66.59 | $63.22 | $46.90 | 6,105 | $99,617.32 | $286,320.43 |
| PSY 101 | $94.11 | $91.11 | $86.85 | 5,998 | $25,549.94 | $520,946.29 |
| Statewide Average | $81.40 | $65.54 | $53.68 | |||
| Total | 112,462 | $1,128,066.55 | $5,475,944.07 |
Figure 5: 2017-2019 cost comparison for highest-enrolled courses
Maximum and Minimum Cost Comparisons
The maximum cost of course materials represents the retail price for brand-new materials; the minimum is the lowest possible price that a student could find through the campus store. The difference between these two price points highlights the efforts of bookstore managers to keep textbook prices down through negotiations with publishers as well as used book, digital, and rental options.
In 2015, on average, the difference between the maximum and minimum prices at the bookstore totaled $1,070.74 – a significant savings for the savvy shopper. In 2017, on average, the difference narrowed to $868.89. In 2019, on average, the difference is $717, a steady decline from past years. With maximum prices lower to begin with, the savings to be found will shrink. In 2017, the difference between the maximum and minimum lowest-cost AAOT pathway was $250.59, and in 2019 that difference is $171.11. For community college students every dollar counts, yet these figures demonstrate that as overall prices come down, traditional savings tactics may become less relevant.
Students report, anecdotally, that they are most likely to pay full price for course materials in their very first term. This is before they have established a network of other students who can help them strategize about savings. First generation college students are most likely to be affected by high maximum prices, especially in their first term.
Figure 6 shows the difference between the maximum and minimum materials costs for the AAOT. The orange bars are the maximum (retail) cost of materials, and the yellow bars are the minimum that a student might pay for materials at the bookstore through rentals, used materials, required only, etc. The green line shows the difference between the maximum and minimum costs.
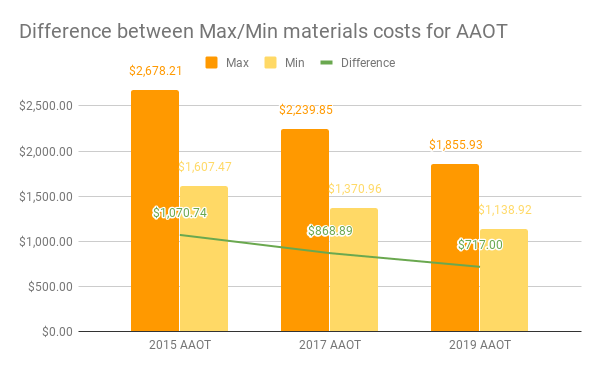
Figure 6: Difference between maximum and minimum prices for AAOT materials
Hours at Minimum Wage Comparisons
It is illustrative to calculate the number of hours it would take at minimum wage to pay for average materials costs at each college. Note that not all community college students earn minimum wage, and that Idaho, Washington, and California students work in their home states but take courses at Oregon community colleges (sometimes paying out-of-state tuition as well).
When the benchmark study was conducted in 2015, the statewide minimum wage was $9.25/hr. Beginning July 1, 2016, Oregon’s minimum wage has increased each year, and additionally there are different rates for the Portland Metro area and nonurban counties (more information on this at Oregon Minimum Wage Rate Summary); this analysis takes into account these changes.
Figure 7, below, shows the number of hours it would take at the respective minimum wage to earn the average cost of materials for AAOT and ASOT-BUS degrees (averaging the high and low materials costs for the degree) in the three years that data was gathered. Statewide, the average number of hours that a student would have to work at minimum wage to cover the costs of materials is down, as a result of both lower average textbook prices and increased wages. The figure shows that the average lowest-cost AAOT degree pathway represents not just a financial savings, but a tremendous time savings as well.
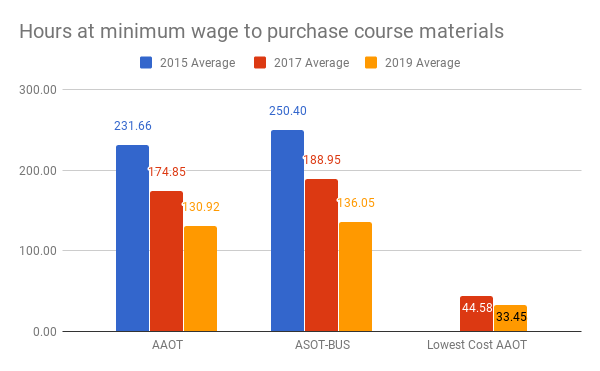
Figure 7: How many hours at minimum wage to buy course materials for transfer degrees?
Course Materials to Tuition Cost Comparisons
Last, it is possible to compare the cost of course materials with the cost of tuition. Because community college tuition is relatively low, course materials costs represent a larger proportion of the total cost of a degree than they do at a four-year college or university. That said, tuition at every college in Oregon has gone up since this research project began in 2015, with an average statewide tuition increase of 14% in the colleges over the last four years.
The data shows that rising tuition costs can be offset by course materials savings. This finding suggests that tuition increases may be more palatable for students if administrators put real support behind textbook affordability initiatives to find the savings elsewhere. It also may be possible to complete a degree more quickly if funds for education can be spent on tuition rather than course materials.
Figure 8, below, shows average materials cost for AAOT and ASOT-BUS degrees as a percentage of average in-state tuition per credit hour in the three years that data was gathered.
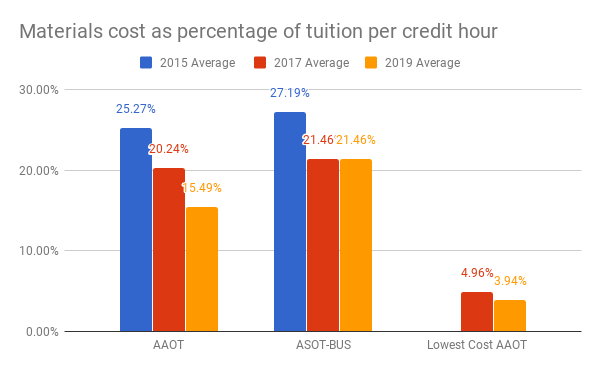
Figure 8: Materials cost as percentage of tuition per credit hour
Conclusions
The 2015 study established that Oregon community colleges, on average, were slightly below the College Board’s national estimate for course materials. In 2017, the second round of research demonstrated that, compared with the 2015 benchmark, statewide average materials costs for transfer degrees had fallen by 16%. The 2017 study also established that where no-cost and low-cost course materials information is available in the course schedule, the lowest-cost degree pathway offers a huge potential savings of 75% over the average materials cost.
The present study shows that statewide, average course materials costs continue their downward trend. The results show that over the four years that Oregon has invested statewide funding in textbook affordability, Oregon’s community colleges have succeeded in reducing the cost of course materials for transfer degrees. The lowest-cost degree pathway continues to represent a potential savings of 75% over the average materials cost, demonstrating that the no-cost/low-cost schedule designation is high-impact and worth prioritizing. As we gain evidence that there are viable models to lower costs for students without compromising on quality, colleges will have to reconsider the role of the campus store.
Oregon’s community colleges are doing the hard work of reducing course material costs, and the benefits for students are clear. Yet without department- and institution-wide commitments to low-cost and no-cost materials, students will have unpredictable experiences with the same curriculum. Oregon’s colleges can consolidate the gains made over the past four years by extending the benefit of the lowest-cost pathway to all students. These pathways have the potential to become a curriculum that can be marketed widely to students.

Thank you for doing this data collection and analysis, Amy! It’s helpful and encouraging for those of us working on textbook affordability at Oregon colleges.
Pingback: OER in Oregon Shrinks Cost of Course Materials by Three-Quarters | | Thailand Times of News